Thirty forest inventory plots have recently been established through forested areas on Clarkson’s hill campus. A short blue bar and red paint on trees around the bar mark the center of forest plots. These plots will help us track the health, diversity, and carbon storage of our woods. This project has been done as part of the ISE’s Fiscal Year 20 Sustainability Project. We received some help from both The Nature Conservancy (Adirondack Chapter) and Empire State Forestry (located in Potsdam). We created a shape file of Clarkson’s forest using ArcGIS and imported that shapefile into iTree. iTree generated a map of random locations to establish the forest inventory plots. During future fall semesters, a biology lab currently ran by Dr. Stefanie Kring will break into groups to inventory each of these plots. We will then process the data through iTree to generate a report quantifying the carbon stock, diversity, health, pollution absorption, hydrological impacts, and other ecological benefits derived from our forests.
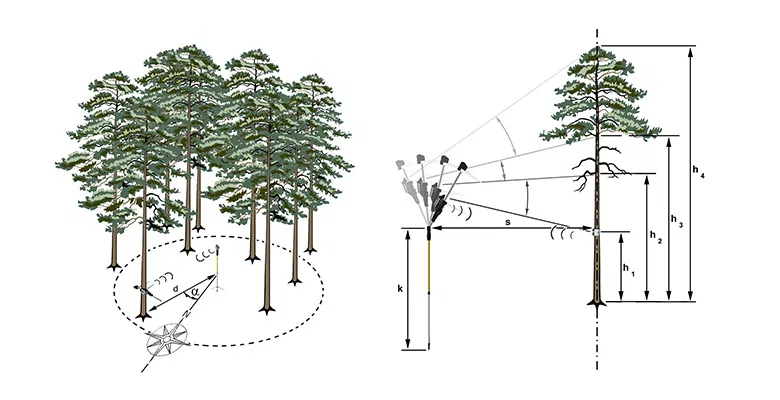
(image from Forestrypedia: What is a Forest Inventory)